Wisen IT Solutions

AI-Paired Matplotlib Training

Master PythonData VisualizationBuild Better Insights

Learn Matplotlib through practical visualization, statistical analysis, EDA, time-series, financial, and scientific plotting.

Matplotlib training in figures, axes, subplots and publication-ready charts at Wisen IT Solutions, Chennai, India
The Wisen Difference

Matplotlib Course for AI-Ready Data Visualization Careers

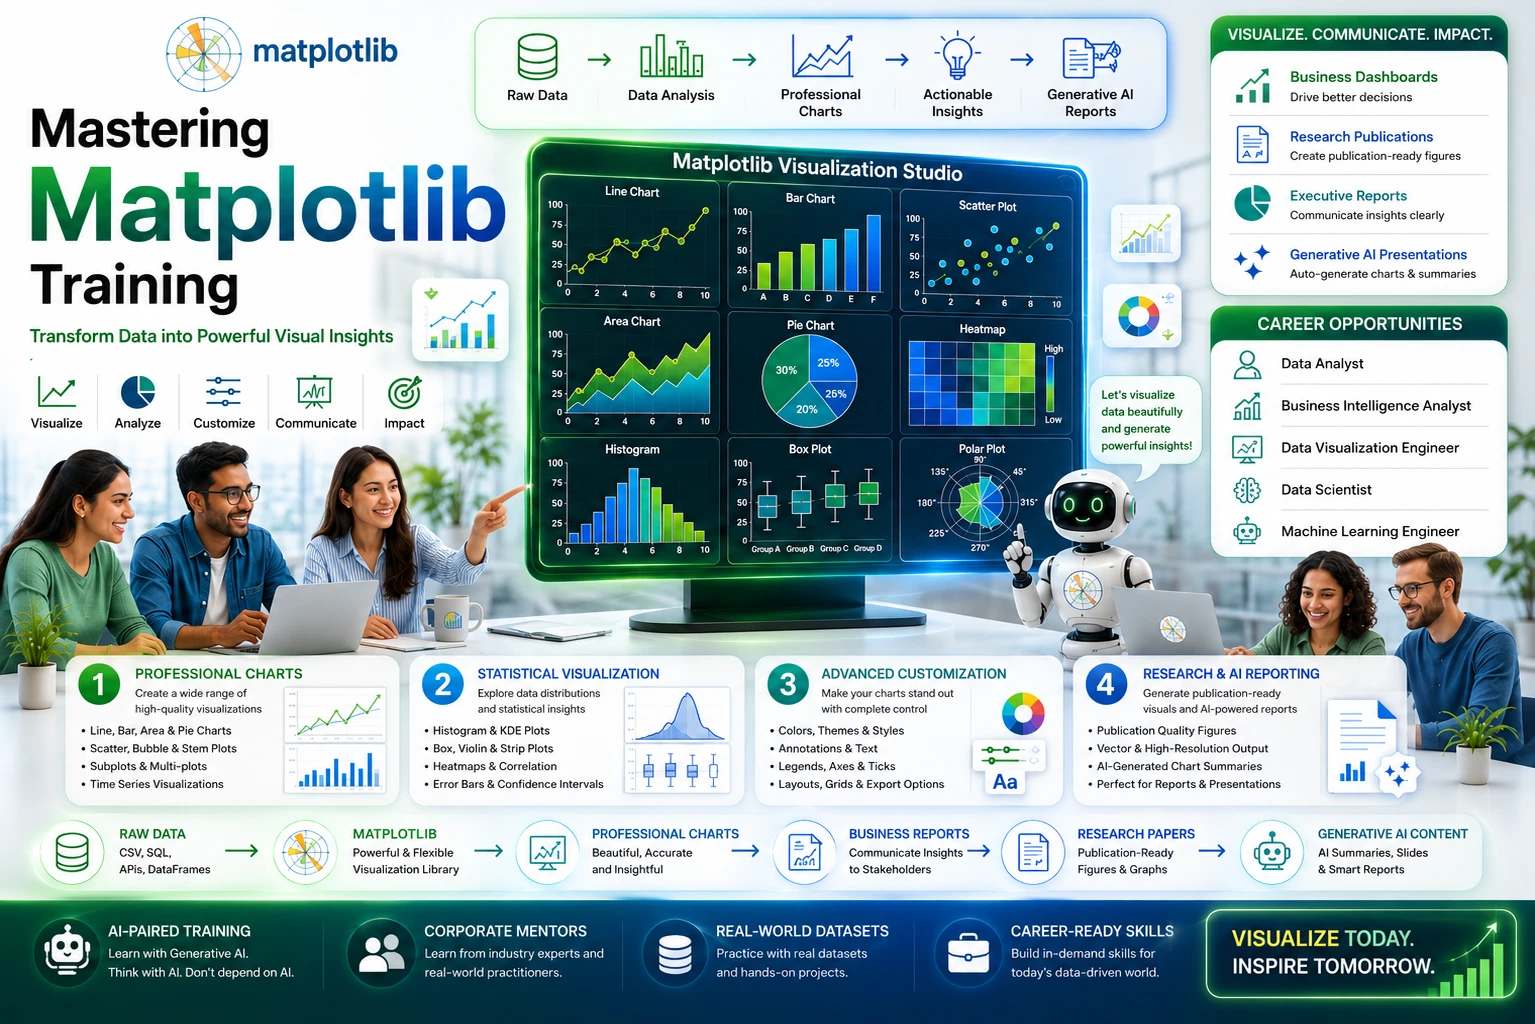
Matplotlib Training at Wisen, Chennai, India, develops practical skills for creating meaningful data visualizations with Python. Learn figure and axes, plots, subplots, annotations, styling, legends, labels, colors, scales, layouts, statistical charts, and publication-ready visualizations through project-focused, AI-Assisted Learning for real-world data workflows.

  • AI-Era Data Visualization Skills
  • Project-Relevant Visualization Skills
  • Professional Python Visualization Workflows
  • AI-Assisted Visualization Development
  • Project-Ready Python Matplotlib Skills
  • 2,700+ Happy Students/Year

Development Practices Used in Modern AI-Driven Teams.Human Creativity. AI-Enabled Development.

Wisen IT Solutions, Chennai, India

Visualize. Analyze. Communicate.

Matplotlib Course for the AI-Era

Build practical Matplotlib skills for the AI-Era through hands-on training in data plotting, chart customization, statistical visualization, subplots, annotations, styling, and publication-ready graphics. Learn to transform data into clear visual stories, develop project-ready, AI-ready data visualization skills, and open new AI-driven career opportunities in data analysis and visualization.

Chapter 01

Introduction to Matplotlib Topics

  • What is Data Visualization?
  • Why Matplotlib?
  • Matplotlib Architecture
  • Backends Overview
  • Installing Matplotlib
  • Matplotlib in PyCharm
  • Matplotlib in Jupyter Notebook
  • pyplot Module
  • Your First Plot
  • plt.show() Behaviour
  • Inline vs Interactive Mode
  • Saving a Figure
  • Figure File Formats
  • DPI and Resolution
Chapter 01

Introduction to Matplotlib Topics

  • What is Data Visualization?
  • Why Matplotlib?
  • Matplotlib Architecture
  • Backends Overview
  • Installing Matplotlib
  • Matplotlib in PyCharm
  • Matplotlib in Jupyter Notebook
  • pyplot Module
  • Your First Plot
  • plt.show() Behaviour
  • Inline vs Interactive Mode
  • Saving a Figure
  • Figure File Formats
  • DPI and Resolution
Corporate Matplotlib training for data teams at Wisen IT Solutions, Chennai, India

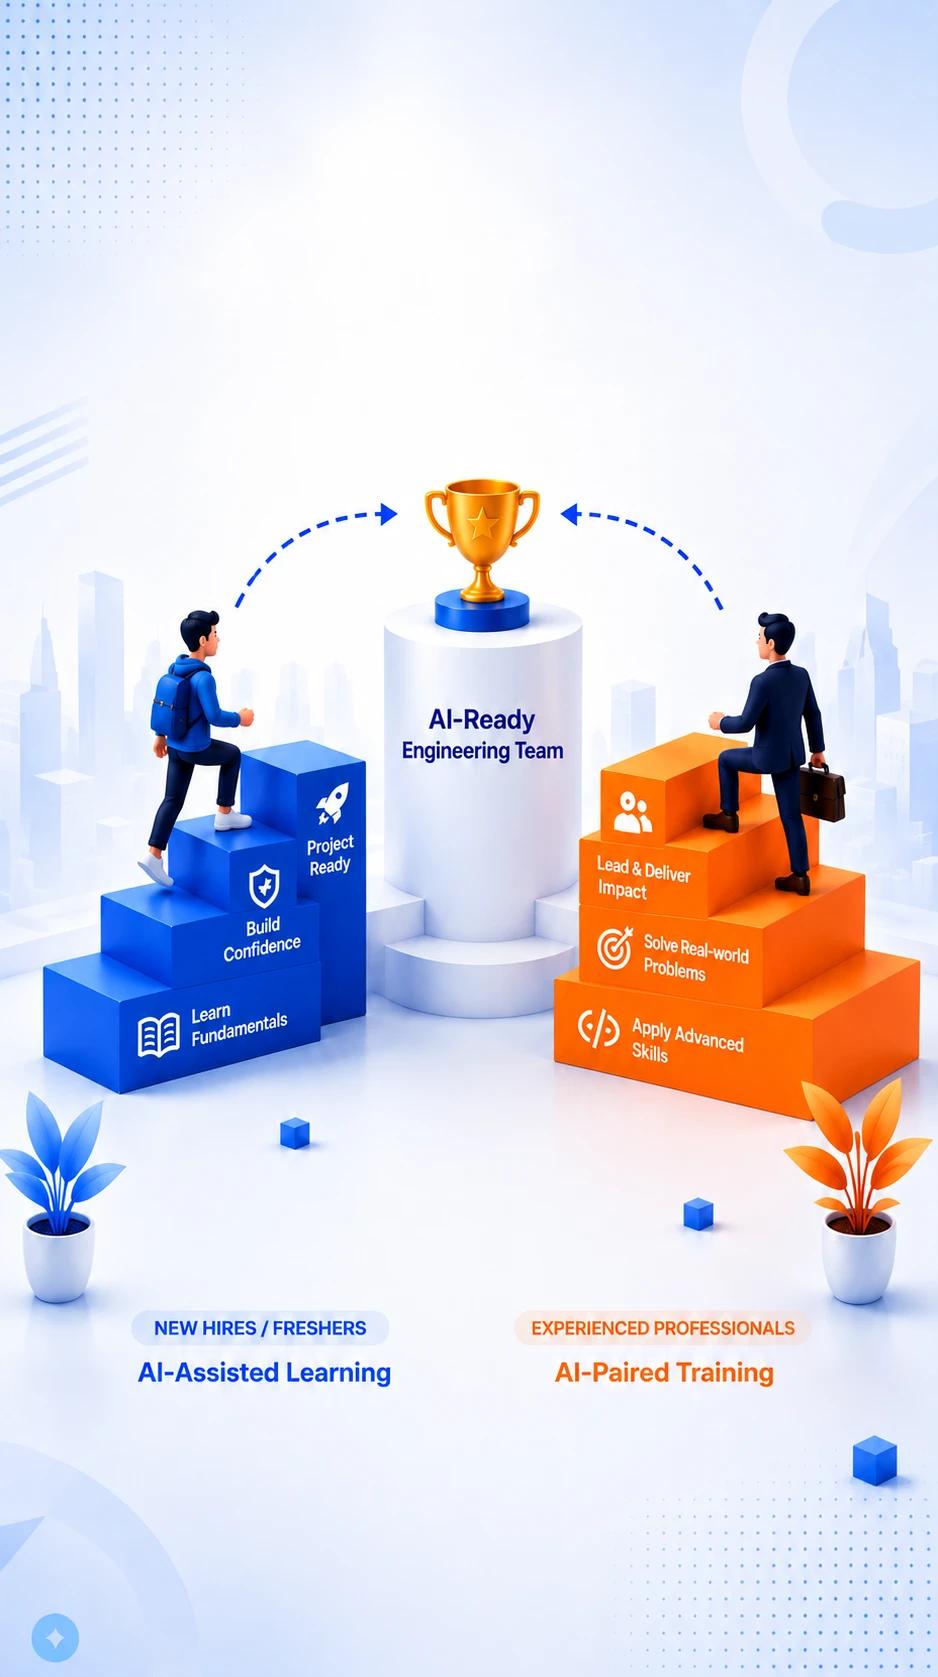
Moving Beyond
Traditional Training
with
AI-Enabled Learning.

AI-Ready Technology
Learning Lab

Moving Beyond
Traditional Training
with AI-Enabled Learning

For Organizations

Corporate Matplotlib Training

Build practical data visualization capabilities through AI-Enabled Learning across Data Plotting, Chart Customization, Statistical Visualization, Subplots, Annotations, Styling, and Publication-Ready Graphics. Wisen’s Matplotlib Training combines AI-Assisted Learning for understanding visualization concepts with AI-Paired Training for practical application, enabling professionals to create clear, effective visualizations and transform data into meaningful visual stories while retaining analytical and creative ownership.

Industry-Relevant Visualization Skills

Develop practical Matplotlib skills aligned with modern data analysis, reporting, scientific computing, and visualization workflows.

AI-Enabled Learning

Use AI to accelerate chart development, visualization exploration, customization, debugging, and insight generation without replacing human judgment.

Induction & Upskilling Programs

Build structured learning paths for new hires, freshers, and existing professionals developing or strengthening their Matplotlib skills.

Hands-On Visualization Workflows

Practice plotting, chart customization, subplots, annotations, statistical visualization, styling, and AI-assisted visualization workflows.

Customized Corporate Programs

Align training with your team’s roles, datasets, reporting requirements, technology stack, projects, and organizational objectives.

AI-Evaluated Skill Development

Evaluate practical progress through AI-assisted assessments that identify strengths, skill gaps, and areas for improvement.

Looking for a tailored Matplotlib training program for your organization? Let’s build the right learning journey for your team.

Explore Corporate Training Page
Plot. Customize. Communicate.

Skills You Gain from Matplotlib Training

Build practical data visualization skills through a Matplotlib Course focused on plotting, figure and axes control, chart customization, annotations, visual comparison, and professional presentation. Develop the ability to turn numerical data into clear visual explanations while building strong foundations for analytics, research, reporting, and AI-enabled visualization workflows.

  • Effective Plot Selection

    Choose appropriate plots based on the structure of your data and the analytical question you want to answer.

  • Data Visualization

    Transform numerical and analytical data into meaningful visual representations that communicate information clearly.

  • Figure and Axes Control

    Understand the relationship between figures, axes, and plotting areas to create well- structured visualizations.

  • Chart Customization

    Customize titles, labels, legends, markers, lines, scales, and other chart elements for improved clarity.

  • Axis Configuration

    Configure axis limits, ticks, labels, scales, and formatting to make visual information easier to interpret.

  • Visual Comparison

    Design charts that make differences between categories, datasets, or measurements easy to recognize.

  • Trend Visualization

    Represent changes and trends effectively using appropriate plotting techniques.

  • Distribution Visualization

    Visualize data distributions to understand variation, concentration, spread, and unusual observations.

  • Multi-Chart Analysis

    Combine multiple plots and coordinate visual elements to support deeper analytical comparisons.

  • Annotation and Explanation

    Add annotations, reference markers, and explanatory elements that guide viewers toward important findings.

  • Professional Chart Design

    Apply consistent layouts, typography, spacing, and visual hierarchy to create polished analytical graphics.

  • Visualization Refinement

    Review and improve charts for readability, accuracy, consistency, and communication effectiveness.

  • Publication-Ready Graphics

    Develop graphics suitable for professional reports, research documents, presentations, and analytical communication using Advanced Matplotlib Training practices.

  • AI-Assisted Visualization

    Use AI to explore plotting approaches, troubleshoot visualization code, and refine implementation while maintaining independent analytical judgment through Python Matplotlib Course workflows.

  • Visual Communication

    Build the ability to explain analytical findings through clear graphics while extending your skills with Matplotlib Full Course and Advanced Matplotlib Course concepts.

Career Transformation Starts Here!

These skills help you progress from basic plotting to purposeful visual communication and professional data presentation. Develop stronger practical capabilities through Matplotlib Course learning and apply them across analytics, research, reporting, and modern AI-enabled visualization workflows.

91-900 31 31 555
Learn. Practice. Master Matplotlib

Matplotlib Training Course Materials

Matplotlib Course learning materials with plotting notes, lab activities and exercises

The material used in this Matplotlib Course has been developed over 27+ years of Python training and reporting experience, refined through classroom batches, corporate Matplotlib Training programs, chart reviews with learners, and figures produced for real business and engineering reports.

Every chapter, plotting example, lab activity, and exercise in this Python Matplotlib Course starts from a question a chart has to answer, so you learn the figure and axes model, styling, and layout while producing plots that would survive a review meeting.

What You'll Receive

Plotting Concept Notes

Written explanations of the figure, axes, and artist model that make Matplotlib predictable instead of trial and error.

Guided Lab Activities

Labs that build a chart step by step — data in, plot out, then labels, ticks, legends, and export.

Hands-on Exercises

Independent Matplotlib Full Course tasks covering line, bar, scatter, histogram, and subplot layouts of increasing difficulty.

Chart Style References

Colour, annotation, and layout guidance for figures that read clearly in slides, print, and dashboards.

Progressive Learning Path

A path from a first plot through multi-panel figures and custom styling to advanced Matplotlib Training topics, with nothing assumed in between.

Revision and Reference Sheets

Compact references for the parameters and API calls that are hardest to recall from memory.

What Makes Our Matplotlib Learning Materials Different?

27+ Years of Experience

Authored by trainers who have taught Python charting since the earliest days of the library.

Human-Authored Content

Prepared and maintained by the trainers who take the sessions, page by page.

Original Learning Materials

Written in-house — not the gallery examples repeated with a new heading.

Practice First

Every concept comes with a figure you draw yourself and then improve.

Continuously Refined

Reworked from learner feedback and updated as the library and its defaults change.

AI-Assisted Quality Review

AI helps only with grammar, readability, and presentation of the written material.

Our Commitment

Our published curriculum is the evidence of our training.

The Matplotlib topics on this website describe the actual learning journey of our live instructor-led online training. We follow the published sequence and add further chart walkthroughs, styling techniques, and reporting scenarios whenever they make the learning stronger.

Experience DrivenPractice FocusedResults Oriented
Plot. Review. Become Chart-Ready.

Matplotlib Course Evaluation

Every Matplotlib Course learner is assessed twice, and independently: an experienced trainer reviews how you build a figure, and an independent AI evaluation reviews the plotting code you write. The two together tell you whether your charts are merely running or genuinely readable.

This dual approach matters more in plotting than almost anywhere else in Python. Code that raises no error can still produce an unlabelled axis, a misleading scale, or a figure that falls apart when exported. Matplotlib Training feedback covers both the code and the chart it draws.

Human Evaluation

Our experienced trainers evaluate your ability to:

Figure and Axes Model

Explain the difference between the pyplot interface and the object-oriented Figure and Axes API, and choose the right one.

Chart Selection

Pick the plot type that answers the question your data is actually being asked.

Plot Construction

Build multi-axes figures, subplots and shared scales without guesswork.

Labelling Discipline

Title, label, unit and annotate every chart so it is readable without you standing beside it.

Styling and Colour

Apply colormaps, styles and rcParams deliberately rather than by trial and error.

Debugging Figures

Diagnose blank plots, clipped labels, overlapping ticks and backend issues.

Reusable Plot Code

Turn one-off plotting scripts into functions your team can call again.

Export Quality

Produce figures at the size, DPI and format the report or publication requires.

Visualization Readiness

Take a raw dataset through to a finished, defensible figure independently.

Independent AI Evaluation

Our independent AI evaluation reviews your Matplotlib programs to assess:

API Consistency

Verify that figures are built through one coherent interface rather than mixed styles.

Plotting Logic

Analyse how the data is prepared and mapped onto the axes.

Matplotlib Conventions

Evaluate adherence to current Matplotlib practice and deprecation-free usage.

Code Quality

Review readability, structure and the reuse of plotting helpers.

Chart Defects

Identify missing labels, wrong scales, hard-coded limits and silent data truncation.

Rendering Performance

Suggest improvements for large scatter plots, repeated draws and figure memory use.

Best Practices

Recommend improvements based on modern Python Matplotlib Course standards.

Chart Readiness

Evaluate whether your figures would survive review in a real report.

Why Dual Evaluation?

Human trainers judge whether the chart communicates the point you meant to make.

AI independently checks the plotting code for defects, conventions and performance.

Together they cover both halves of a good figure, the code behind it and the message on it.

Learning Outcome

By combining Human Evaluation with Independent AI Evaluation across the Matplotlib Full Course and our Advanced Matplotlib Training modules, you will:

  • Build figures with the object-oriented API by habit
  • Choose and defend the chart type for a given dataset
  • Write plotting code that is reusable, not disposable
  • Produce publication-quality exports on the first attempt
  • Become project-ready for reporting, analytics and research visualization work
AI-Assisted Plotting Practice

Matplotlib Course Duration & Batch Timings

Matplotlib Training at Wisen IT Solutions, Chennai is a live plotting workshop offered in two paces, because a figure you build yourself teaches more than one you watch being built.

Total Learning Hours

35 - 40 Hours

Instructor-led figure sessionsChart-building practiceStyling labsPublication-quality projects

Normal Track

2.5 Hours / Session

A relaxed pace with room to redraw and refine charts between Matplotlib Course sessions.

  • Working Professionals
  • College Students
  • Report Authors
  • Weekend Batches

Fast Track

5 Hours / Session

A dense schedule that covers the Matplotlib Full Course in a much shorter window.

  • Full-time Learners
  • Job Seekers
  • Fresh Graduates
  • Research Students

What's Included?

Live Instructor-Led Training

Figure & Axes Concept Learning

Hands-on Plotting Sessions

Chart Type Lab Activities

Styling & Annotation Exercises

AI-Assisted Learning

Independent Chart Evaluation

Doubt Clarification

Export & Publication Guidance

Same Curriculum |
Same Labs |
Same Evaluation |
Same Learning Outcome

The Advanced Matplotlib Training syllabus is the same on both tracks — every Python Matplotlib Course batch draws the same figures and is assessed the same way.

Balanced Learning. Plot by Plot. Publication-Ready Figures.

Lecture-Practical Ratio

A chart is judged by how it looks, so it has to be drawn, not described. This Matplotlib Course runs on a 50:50 Lecture-Practical Ratio: every axes, artist and styling concept is plotted on screen in the same session it is explained.

Through the Matplotlib Training you build figures from a blank canvas, fix the ones that look wrong, and export them at print quality — the working method the Advanced Matplotlib Course keeps to throughout.

50%Theory

Understand the object model under every Matplotlib chart.

  • Figure, Axes and Artist hierarchy
  • pyplot versus object-oriented API
  • Coordinate systems and transforms
  • Colormaps and colour theory
  • Backends and rendering
  • Chart selection principles
50:50Balanced Learning

50%Practical

Draw, restyle and export figures throughout the session.

  • Live plotting demonstrations
  • Line, bar, scatter and histogram labs
  • Subplot and gridspec exercises
  • Annotation and legend practice
  • Custom style sheet building
  • Export and DPI tuning sessions
  • AI-assisted chart critique exercises

Why a 50:50 Split Works for Matplotlib

Grasp the Object Model

Know which object owns the property you want to change.

Plot as You Learn

Each parameter is seen on a live figure, not read from docs.

Develop Design Judgement

Compare your chart against a clearer version of it.

Fix Broken Layouts

Clipped labels and cramped subplots get solved in the lab.

Ship Real Figures

Finish the Python Matplotlib Course able to produce report-ready output.

Our Learning Philosophy

Every Matplotlib concept is followed by a figure you plot and refine yourself.Wisen IT Solutions, Chennai teaches this Matplotlib Full Course on the belief that visualisation is a craft learned by drawing charts, not by studying screenshots of them.

No Design Background. No Plotting Experience. Just Python Basics.

Matplotlib Course Prerequisites

This Matplotlib Course starts at the first plt.plot() call. Figures, axes, subplots and styling are taught from scratch, so no charting or design experience is expected of you on day one.

The Matplotlib Training is live online and instructor-led, and the Advanced Matplotlib Training topics later in the Matplotlib Full Course are reached from the same beginner start line.

Basic Python

  • Lists and dictionaries
  • Loops and simple functions
  • Importing a library
  • Running a script or a notebook cell

A Reader’s Eye

  • Interest in what makes a chart readable
  • Willingness to redraw a figure until it is clear
  • Attention to labels, units and legends
  • Commitment to the plotting lab exercises

Plotting Setup

  • Windows OS with a stable internet connection
  • Python 3.x — installation guidance provided
  • Matplotlib and NumPy installed with you in class
  • Jupyter Notebook or VS Code for figure previews

Who Can Join?

Students & Graduates

Report & Dashboard Builders

Researchers & Lab Users

Analysts who need publication-quality figures

No Statistics Or Design Skills Needed

You do not need a statistics module or a graphic-design course behind you to take this Python Matplotlib Course. We begin with one line chart and progress to multi-panel figures, custom styling and export-ready output, explaining the reasoning behind each choice as we go.

All you need is basic Python, a computer and something you want to show clearly.

We’ll take care of the rest!
Figure. Axes. Artist. In That Order.

Matplotlib Course Tools & Technologies

This Matplotlib Course teaches the object-oriented interface — Figure, Axes and Artist — instead of the pyplot shortcuts, because that is the only way to control a complex figure precisely.

The Matplotlib Training then covers backends, style sheets, custom colormaps and publication-grade export. That depth is what makes it an Advanced Matplotlib Course rather than a plotting cheatsheet, and it is why this Python Matplotlib Course expects you to build figures, not copy them.

Figure Architecture

Figure & Axes API

Artist Layer

subplots & GridSpec

Constrained Layout

Backends

Plot Types

Line & Step

Bar & Histogram

Scatter

Fill & Error Bars

imshow & pcolormesh

Contour Plots

Styling & Text

Colormaps & Norms

rcParams & Style Sheets

Fonts & Mathtext

Annotations & Arrows

Ticks, Locators & Formatters

Legends

Output & Integration

savefig & DPI

Vector PDF & SVG

Animations

Pandas Plotting Hooks

Notebook Embedding

Learning Outcome

This Matplotlib Full Course leaves you able to build any figure a journal, a board deck or a dashboard asks for, and to reproduce it exactly — the practical promise of Advanced Matplotlib Training.

Control Every Element

Compose Multi-Panel Figures

Own Your House Style

Export Publication-Grade

Got Questions - Quick Answers

Matplotlib Training Frequently Asked Questions

27+
Years of Experience
17,700+
Professionals Empowered
2,700+
Happy Learners Every Year
30+
Corporate Clients

Corporate Training Clients

A Trusted Training Institute Upskilling Teams at Leading Companies Worldwide

A Wisen IT Solutions Python training advisor pointing towards the enquiry number

Build Future-Ready Skills. Gain Project-Ready Experience.
Succeed in AI-Transformed Careers.

The software industry is evolving with AI—not disappearing. Wisen's AI-Enabled Learning helps you master modern technologies, build strong engineering fundamentals, and collaborate effectively with AI tools like ChatGPT and Claude. Develop the practical skills, critical thinking, and real-world experience needed to build software with confidence and remain valuable throughout your career.

Talk to our AI Learning Advisor

+91 900 31 31 555