Wisen IT Solutions

AI-Paired Training

MasterPythonDataVisualizationwith Seaborn

Learn to visualize, analyze, and uncover insights from data with practical, AI-paired Seaborn training. Build the skills to turn data into smarter decisions and an AI-Ready Career.

Start Your AI-Paired Journey
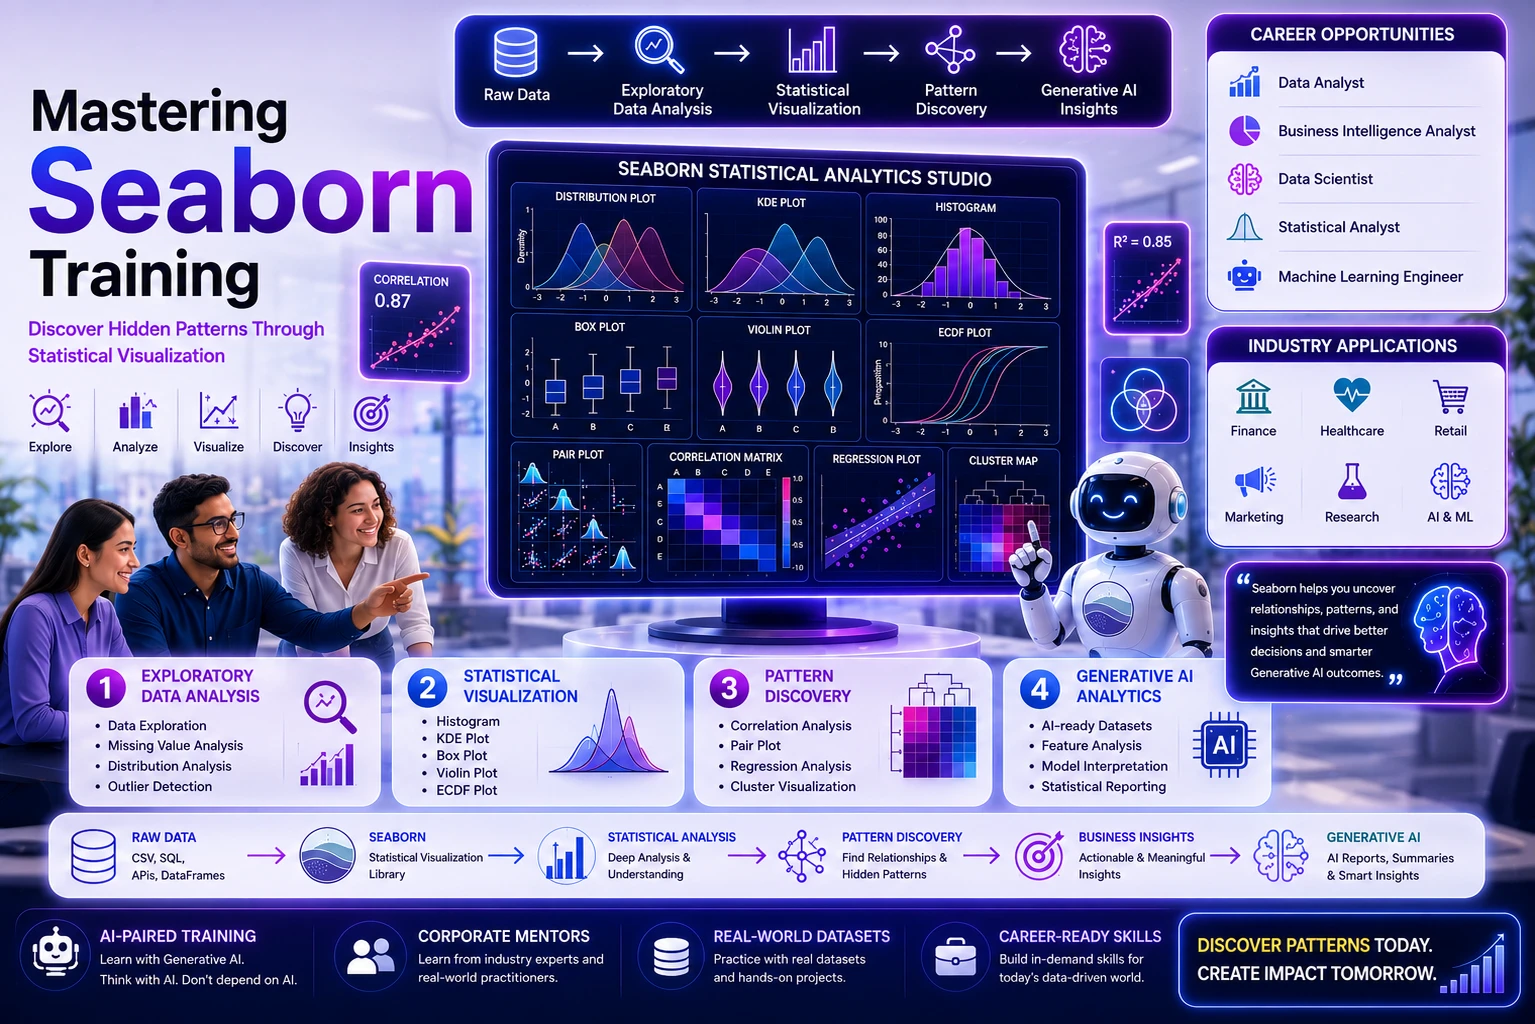
Seaborn training in statistical plots, distributions and regression visualization at Wisen IT Solutions, Chennai, India
The Wisen Difference

Seaborn Course for AI-Ready Data Visualization Careers

Seaborn Training at Wisen, Chennai, India, develops practical skills for statistical data visualization with Python. Learn relational plots, categorical plots, distributions, statistical estimation, regression visualization, color palettes, themes, subplots, annotations, and advanced visual analysis using real-world datasets through project-focused, AI-Assisted Learning.

  • AI-Era Data Visualization Skills
  • Project-Relevant Statistical Visualization
  • Professional Seaborn Development Skills
  • AI-Assisted Data Visualization
  • Project-Ready Python Seaborn Skills
  • 2,700+ Happy Students/Year

Development Skills Matter More Than Prompt Dependency.Human Thinking + AI Acceleration.

Wisen IT Solutions, Chennai, India

Discover. Visualize. Insight.

Seaborn Course for the AI-Era

Build practical Seaborn skills for the AI-Era through hands-on training in statistical visualization, categorical plots, distributions, relational data, regression analysis, heatmaps, and advanced chart customization. Learn to explore patterns and relationships in data, develop project-ready, AI-ready visualization skills, and open new AI-driven career opportunities in data analysis and visualization.

Chapter 01

Introduction to Seaborn Topics

  • What is Seaborn?
  • Seaborn vs Matplotlib
  • Statistical Graphics Concept
  • Installing Seaborn
  • Importing Conventions
  • Built-in Datasets
  • load_dataset()
  • Tidy (Long) Data Format
  • Wide vs Long Data
  • Your First Seaborn Plot
  • Figure-level vs Axes-level Functions
  • Seaborn Function Families

Chapter 01

Introduction to Seaborn Topics

  • What is Seaborn?
  • Seaborn vs Matplotlib
  • Statistical Graphics Concept
  • Installing Seaborn
  • Importing Conventions
  • Built-in Datasets
  • load_dataset()
  • Tidy (Long) Data Format
  • Wide vs Long Data
  • Your First Seaborn Plot
  • Figure-level vs Axes-level Functions
  • Seaborn Function Families

Corporate Seaborn training for data teams at Wisen IT Solutions, Chennai, India

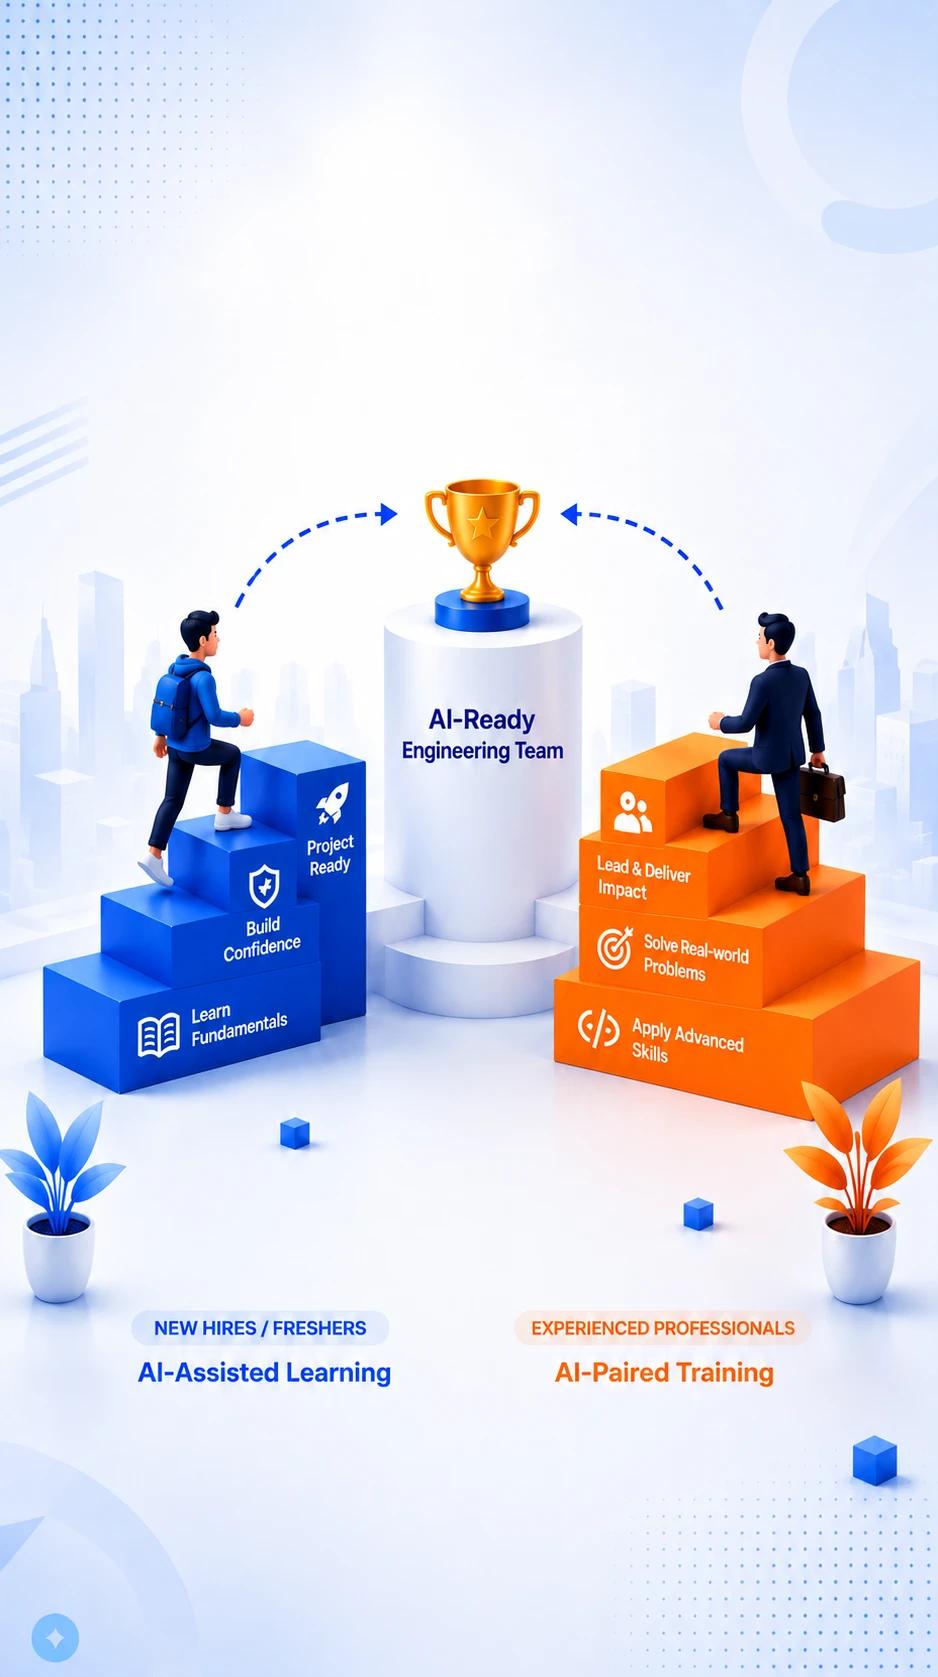
Moving Beyond
Traditional Training
with
AI-Enabled Learning.

AI-Ready Technology
Learning Lab

Moving Beyond
Traditional Training
with AI-Enabled Learning

For Organizations

Corporate Seaborn Training

Build practical statistical visualization capabilities through AI-Enabled Learning across Statistical Graphics, Distribution Visualization, Categorical Visualization, Relational Analysis, Regression Visualization, and AI-Assisted Visualization Workflows. Wisen’s Seaborn Training combines AI-Assisted Learning for understanding statistical visualization concepts with AI-Paired Training for practical application, enabling professionals to explore patterns, relationships, and distributions in data while retaining analytical thinking and visualization judgment.

Industry-Relevant Visualization Skills

Develop practical Seaborn skills aligned with modern data analysis, statistical visualization, and analytics workflows.

AI-Enabled Learning

Use AI to accelerate visualization exploration, chart selection, statistical interpretation, and problem-solving without replacing analytical judgment.

Induction & Upskilling Programs

Build structured learning paths for new hires, freshers, and existing professionals developing or strengthening their Seaborn skills.

Hands-On Visualization Workflows

Practice statistical plots, distributions, categorical analysis, relational plots, regression visualization, and AI-assisted visualization workflows.

Customized Corporate Programs

Align training with your team’s roles, datasets, analytical requirements, technology stack, projects, and organizational objectives.

AI-Evaluated Skill Development

Evaluate practical progress through AI-assisted assessments that identify strengths, skill gaps, and areas for improvement.

Looking for a tailored Seaborn training program for your organization? Let’s build the right learning journey for your team.

Explore Corporate Training Page
Explore. Visualize. Discover.

Skills You Gain from Seaborn Training

Build practical statistical visualization skills through a Seaborn Course focused on distributions, relationships, categorical comparisons, correlation patterns, and analytical storytelling. Learn to create informative visualizations that help reveal patterns in structured data while developing stronger visual reasoning for analytics, research, and AI-enabled data workflows.

  • Statistical Visualization

    Create meaningful statistical graphics that make analytical patterns easier to interpret and communicate.

  • Distribution Analysis

    Examine how numerical values are distributed and identify concentration, spread, and unusual observations.

  • Categorical Comparison

    Compare categories and groups effectively using appropriate statistical visualization techniques.

  • Relationship Analysis

    Explore relationships between variables and identify meaningful associations within datasets.

  • Trend Exploration

    Visualize changes across categories or numerical dimensions to identify important trends and patterns.

  • Outlier Identification

    Use visual analysis to recognize unusual observations that may require further investigation.

  • Correlation Exploration

    Examine relationships between numerical variables and communicate correlation patterns visually.

  • Multivariable Analysis

    Analyze multiple variables together to uncover patterns that may not be visible through single-variable analysis.

  • Heatmap Interpretation

    Create and interpret heatmaps to understand relationships, intensities, and patterns across structured data.

  • Visual Grouping

    Organize visualizations around meaningful categories and groups to make analytical comparisons clearer.

  • Visualization Customization

    Refine labels, themes, layouts, palettes, axes, and other visual elements to improve communication.

  • Analytical Storytelling

    Combine visual evidence and analytical reasoning to communicate findings in a structured and understandable way.

  • Visualization Quality Assessment

    Evaluate charts for accuracy, clarity, relevance, consistency, and effective communication through Advanced Seaborn Training practices.

  • AI-Assisted Visualization

    Use AI to explore visualization approaches, troubleshoot implementation, and improve analytical graphics while retaining independent reasoning through Seaborn Full Course workflows.

  • Insight Communication

    Convert visual patterns into understandable analytical conclusions while applying Python Seaborn Course techniques and Advanced Seaborn Course concepts.

Career Transformation Starts Here!

These skills help you progress from basic chart creation to deeper statistical exploration and insight communication. Develop practical visualization confidence through structured learning and apply these capabilities across analytics, research, reporting, and modern AI-enabled data workflows.

91-900 31 31 555
Learn. Practice. Master Seaborn

Seaborn Training Course Materials

Seaborn Course learning materials with statistical plotting notes and lab exercises

This Seaborn Course is delivered from material built on 27+ years of Python training and analytics experience, shaped by corporate Seaborn Training programs, questions raised in live batches, and statistical graphics produced for genuine analysis work.

Each chapter, plot example, lab activity, and exercise in this Seaborn Full Course pairs a statistical idea with the plot that reveals it — distributions, relationships, categories, and correlations — so charts become a way of reasoning about data, not decoration added at the end.

What You'll Receive

Statistical Plotting Notes

Explanations of figure-level and axes-level plots, tidy data, and when each chart type is the right choice.

Guided Lab Activities

Labs that move a DataFrame through distribution, relationship, and category plots in one session.

Hands-on Exercises

Individual Python Seaborn Course tasks on faceting, hue mapping, estimators, and confidence intervals.

Practice Datasets

Tidy and untidy datasets, so reshaping before plotting is practised rather than assumed.

Progressive Learning Path

A sequence from a first statistical plot to multi-panel grids, themed output, and advanced Seaborn Training material.

Revision and Reference Sheets

Quick references mapping each analytical question to the Seaborn function that answers it.

What Makes Our Seaborn Learning Materials Different?

27+ Years of Experience

Written by trainers with decades of Python teaching and statistical reporting behind them.

Human-Authored Content

Composed and revised by the trainers who deliver the Seaborn Training themselves.

Original Learning Materials

Developed in-house rather than borrowed from documentation galleries or tutorial sites.

Practice First

Each statistical idea is taught through a plot you produce and interpret.

Continuously Refined

Kept current with Seaborn releases, including the objects interface and changing defaults.

AI-Assisted Quality Review

AI is used for language and presentation checks alone, never for the teaching itself.

Our Commitment

The curriculum we publish is the training we deliver.

The Seaborn topics listed on this website reflect the real learning journey of our live instructor-led online sessions. We teach the published order and enrich it with additional plot interpretations, dataset walkthroughs, and analysis scenarios wherever they help.

Experience DrivenPractice FocusedResults Oriented
Explore. Review. Become Analysis-Ready.

Seaborn Course Evaluation

Seaborn Training is evaluated on two independent tracks. A trainer assesses how you move from a question about a dataset to the statistical plot that answers it; an independent AI evaluation reviews the Seaborn code and the figure it produces.

Because Seaborn does so much for you, from aggregation to estimation and confidence intervals, a plot can look finished while quietly showing something you never intended. Both evaluations in this Seaborn Course are aimed squarely at that risk.

Human Evaluation

Our experienced trainers evaluate your ability to:

Statistical Plot Choice

Select between relational, distributional and categorical plots for the question at hand.

Tidy Data Thinking

Reshape a DataFrame into the long form Seaborn expects before plotting.

Figure-Level Control

Use figure-level and axes-level functions knowingly, not interchangeably.

Reading the Estimate

Explain what the error bars, estimators and confidence intervals on your plot mean.

Theme and Palette Use

Apply themes and palettes that support the comparison rather than decorate it.

Faceting Skills

Build small-multiple layouts that stay legible as categories grow.

Matplotlib Interop

Drop down to the underlying Axes when Seaborn alone cannot finish the figure.

Interpretation

Describe honestly what the chart does and does not support.

Analysis Readiness

Carry an unfamiliar dataset through exploratory analysis to a shareable figure.

Independent AI Evaluation

Our independent AI evaluation reviews your Seaborn programs to assess:

Concept Application

Verify that the chosen Seaborn function fits the variables passed to it.

Analytical Reasoning

Analyse the grouping, hue and estimator choices behind the plot.

Seaborn Practices

Evaluate adherence to current API usage across the Python Seaborn Course material.

Code Quality

Review readability, data preparation and repetition in your plotting code.

Statistical Mistakes

Identify misleading aggregation, dropped rows and unstated assumptions.

Efficiency

Suggest lighter approaches for large frames and repeated faceted draws.

Best Practices

Recommend improvements based on modern statistical-visualization practice.

Reporting Readiness

Evaluate whether the figure would stand up in an analysis review.

Why Dual Evaluation?

Human trainers assess whether you understand the statistics the plot is showing.

AI independently reviews the code, the data preparation and the API choices.

Together they catch both the coding error and the analytical one, which are rarely the same mistake.

Learning Outcome

By combining Human Evaluation with Independent AI Evaluation across the Seaborn Full Course and our Advanced Seaborn Training modules, you will:

  • Match statistical plot types to real analytical questions
  • Prepare tidy data as a reflex before plotting
  • Explain every estimate and interval your chart displays
  • Build faceted views that stay readable at scale
  • Become project-ready for exploratory data analysis and reporting roles
AI-Assisted Statistical Plotting

Seaborn Course Duration & Batch Timings

Seaborn Training is a compact live course from Wisen IT Solutions, Chennai with two batch paces, so statistical plotting is learned by drawing, not by reading slides.

Total Learning Hours

30 - 35 Hours

Instructor-led statistical sessionsPlot-building practiceDistribution labsDataset storytelling projects

Normal Track

2.5 Hours / Session

An unhurried pace for learners taking the Seaborn Course beside other commitments.

  • Working Professionals
  • College Students
  • Data Analysts
  • Weekend Batches

Fast Track

5 Hours / Session

A short, intensive route through the Seaborn Full Course for learners with free days.

  • Full-time Learners
  • Job Seekers
  • Fresh Graduates
  • Research Students

What's Included?

Live Instructor-Led Training

Statistical Plot Learning

Hands-on Seaborn Coding

Distribution Lab Activities

Categorical Plot Exercises

AI-Assisted Learning

Independent Chart Evaluation

Doubt Clarification

Theme & Palette Guidance

Same Curriculum |
Same Labs |
Same Evaluation |
Same Learning Outcome

Advanced Seaborn Training covers one syllabus at two speeds. Choosing the faster Python Seaborn Course batch changes the calendar, never the content.

Balanced Learning. Statistical Insight. Cleaner Visual Stories.

Lecture-Practical Ratio

Seaborn hides statistics inside one-line calls, so you have to plot to see what it did. This Seaborn Course keeps a 50:50 Lecture-Practical Ratio: every estimator, aggregation and confidence band is rendered on a real dataset while it is being explained.

The Seaborn Training has you facet, map and theme your own plots, and read what the statistics are saying — the habit the Advanced Seaborn Course is built to instil.

50%Theory

Understand the statistics Seaborn computes for you.

  • Figure-level versus axes-level plots
  • Tidy long-form data expectations
  • Estimators and confidence intervals
  • Distribution and KDE fundamentals
  • Semantic mappings: hue, size, style
  • Palettes and perceptual colour
50:50Balanced Learning

50%Practical

Build statistical plots on real datasets in class.

  • Live statistical plotting demos
  • Relational and categorical plot labs
  • Distribution and regression exercises
  • FacetGrid and PairGrid practice
  • Theme and palette customisation
  • Matplotlib fine-tuning sessions
  • AI-assisted insight-writing exercises

Why a 50:50 Split Works for Seaborn

See What Was Computed

Know which statistic sits behind each shaded band.

Plot Straight Away

One-line APIs are learned by varying their arguments.

Master Faceting

Small multiples make sense once you have built a grid.

Read the Story

Practise stating the finding a chart actually supports.

Present With Confidence

Leave the Python Seaborn Course able to defend every plot you show.

Our Learning Philosophy

Every Seaborn concept is followed by a statistical plot you build and interpret.Wisen IT Solutions, Chennai delivers this Seaborn Full Course on the view that statistical graphics are understood by plotting data, not by trusting a default chart.

Beginner Entry. Tidy-Data First. Statistics Explained As We Go.

Seaborn Course Prerequisites

This Seaborn Course needs basic Python only. Tidy data, the figure-level and axes-level split, and the statistics behind each plot type are all explained in class rather than assumed.

The Seaborn Training is live online, and the Advanced Seaborn Training material in the Seaborn Full Course is reached from the same beginner-friendly first session.

Basic Python

  • Lists and dictionaries
  • Importing a library and calling a function
  • Passing keyword arguments
  • Running a notebook cell

Awareness Of Tabular Data

  • What a row and a column represent
  • Categorical versus numeric values
  • Curiosity about distributions and relationships
  • No prior Pandas mastery required

Visualisation Setup

  • Windows OS with a stable internet connection
  • Python 3.x — guided installation
  • Seaborn, Pandas and Matplotlib installed with you
  • Practice datasets provided by us

Who Can Join?

Students & Graduates

Data Analysts & Reporters

Researchers & Survey Teams

ML learners exploring datasets before modelling

No Statistics Course Required

You do not need a formal statistics background to take this Python Seaborn Course. Distributions, regression overlays, categorical comparisons and multi-plot grids are introduced with the reasoning attached, so the Advanced Seaborn Course topics land as sense rather than syntax.

All you need is basic Python, a computer and a dataset worth exploring.

We’ll take care of the rest!
Tidy Data In. Statistical Figures Out.

Seaborn Course Tools & Technologies

This Seaborn Course is organised the way the library is: figure-level functions for whole layouts, axes-level functions for single panels, and a tidy DataFrame feeding both.

The Seaborn Training covers the newer objects interface alongside the classic API and shows where to drop to Matplotlib for the last ten percent — the reach that marks an Advanced Seaborn Course.

Plotting Interfaces

relplot & displot

catplot

Axes-Level Functions

seaborn.objects

FacetGrid & PairGrid

Statistical Plots

Box & Violin

Strip & Swarm

KDE & ECDF

Regression Plots

Heatmap & Clustermap

Confidence Intervals

Themes & Palettes

set_theme

Colour Palettes

Perceptual Colormaps

Context Scaling

Custom Themes

Data & Escape Hatches

Tidy DataFrames

Long vs Wide Form

Matplotlib Fallthrough

Figure Export

Notebook Workflow

Learning Outcome

The Seaborn Full Course leaves you producing a faceted, statistically honest figure from a tidy DataFrame in a handful of lines — and knowing exactly when this Python Seaborn Course says to reach for Matplotlib instead.

Shape Data Tidy

Facet in One Call

Show Uncertainty

Drop to Matplotlib

Got Questions - Quick Answers

Seaborn Training Frequently Asked Questions

27+
Years of Experience
17,700+
Professionals Empowered
2,700+
Happy Learners Every Year
30+
Corporate Clients

Corporate Training Clients

A Trusted Training Institute Upskilling Teams at Leading Companies Worldwide

A Wisen IT Solutions Python training advisor pointing towards the enquiry number

Build Future-Ready Skills. Gain Project-Ready Experience.
Succeed in AI-Transformed Careers.

The software industry is evolving with AI—not disappearing. Wisen's AI-Enabled Learning helps you master modern technologies, build strong engineering fundamentals, and collaborate effectively with AI tools like ChatGPT and Claude. Develop the practical skills, critical thinking, and real-world experience needed to build software with confidence and remain valuable throughout your career.

Talk to our AI Learning Advisor

+91 900 31 31 555